Objective:
In this How-To, we will explore how to identify new growth opportunities using the Net New Accounts reports in Core iQ. We will explore the following topics:
- How to use any Net New Account report.
- Ways to pull the report to find specific growth opportunities at the branch and/or employee level.
What are the Net New Account reports used for?
Within Core iQ, there are a total of three Net New Accounts reports that can be pulled to assess your newly opened and/or closed Core Deposit, Loan, and Time Deposit accounts. Each report will provide you with three different outputs that are useful for a variety of reasons. The first is the Summary tab, which provides you with a roll up of the net change in accounts for your report. This includes changes in the total number of accounts, as well as balance roll ups for the total value of your opened and closed accounts. Next, the Opened Accounts tab will provide you with a complete list of all the newly opened accounts for the period set within your report. The Closed Accounts tab will provide you with a list of all the closed accounts for that same time period.
As you can see, this report is extremely useful in identifying the changes in accounts which you are experiencing at your financial institution. These summaries can be extremely useful in finding opportunities for growth, so let's explore how to pull the reports and use them for these sorts of outcomes.
How do I pull the Net New Accounts report?
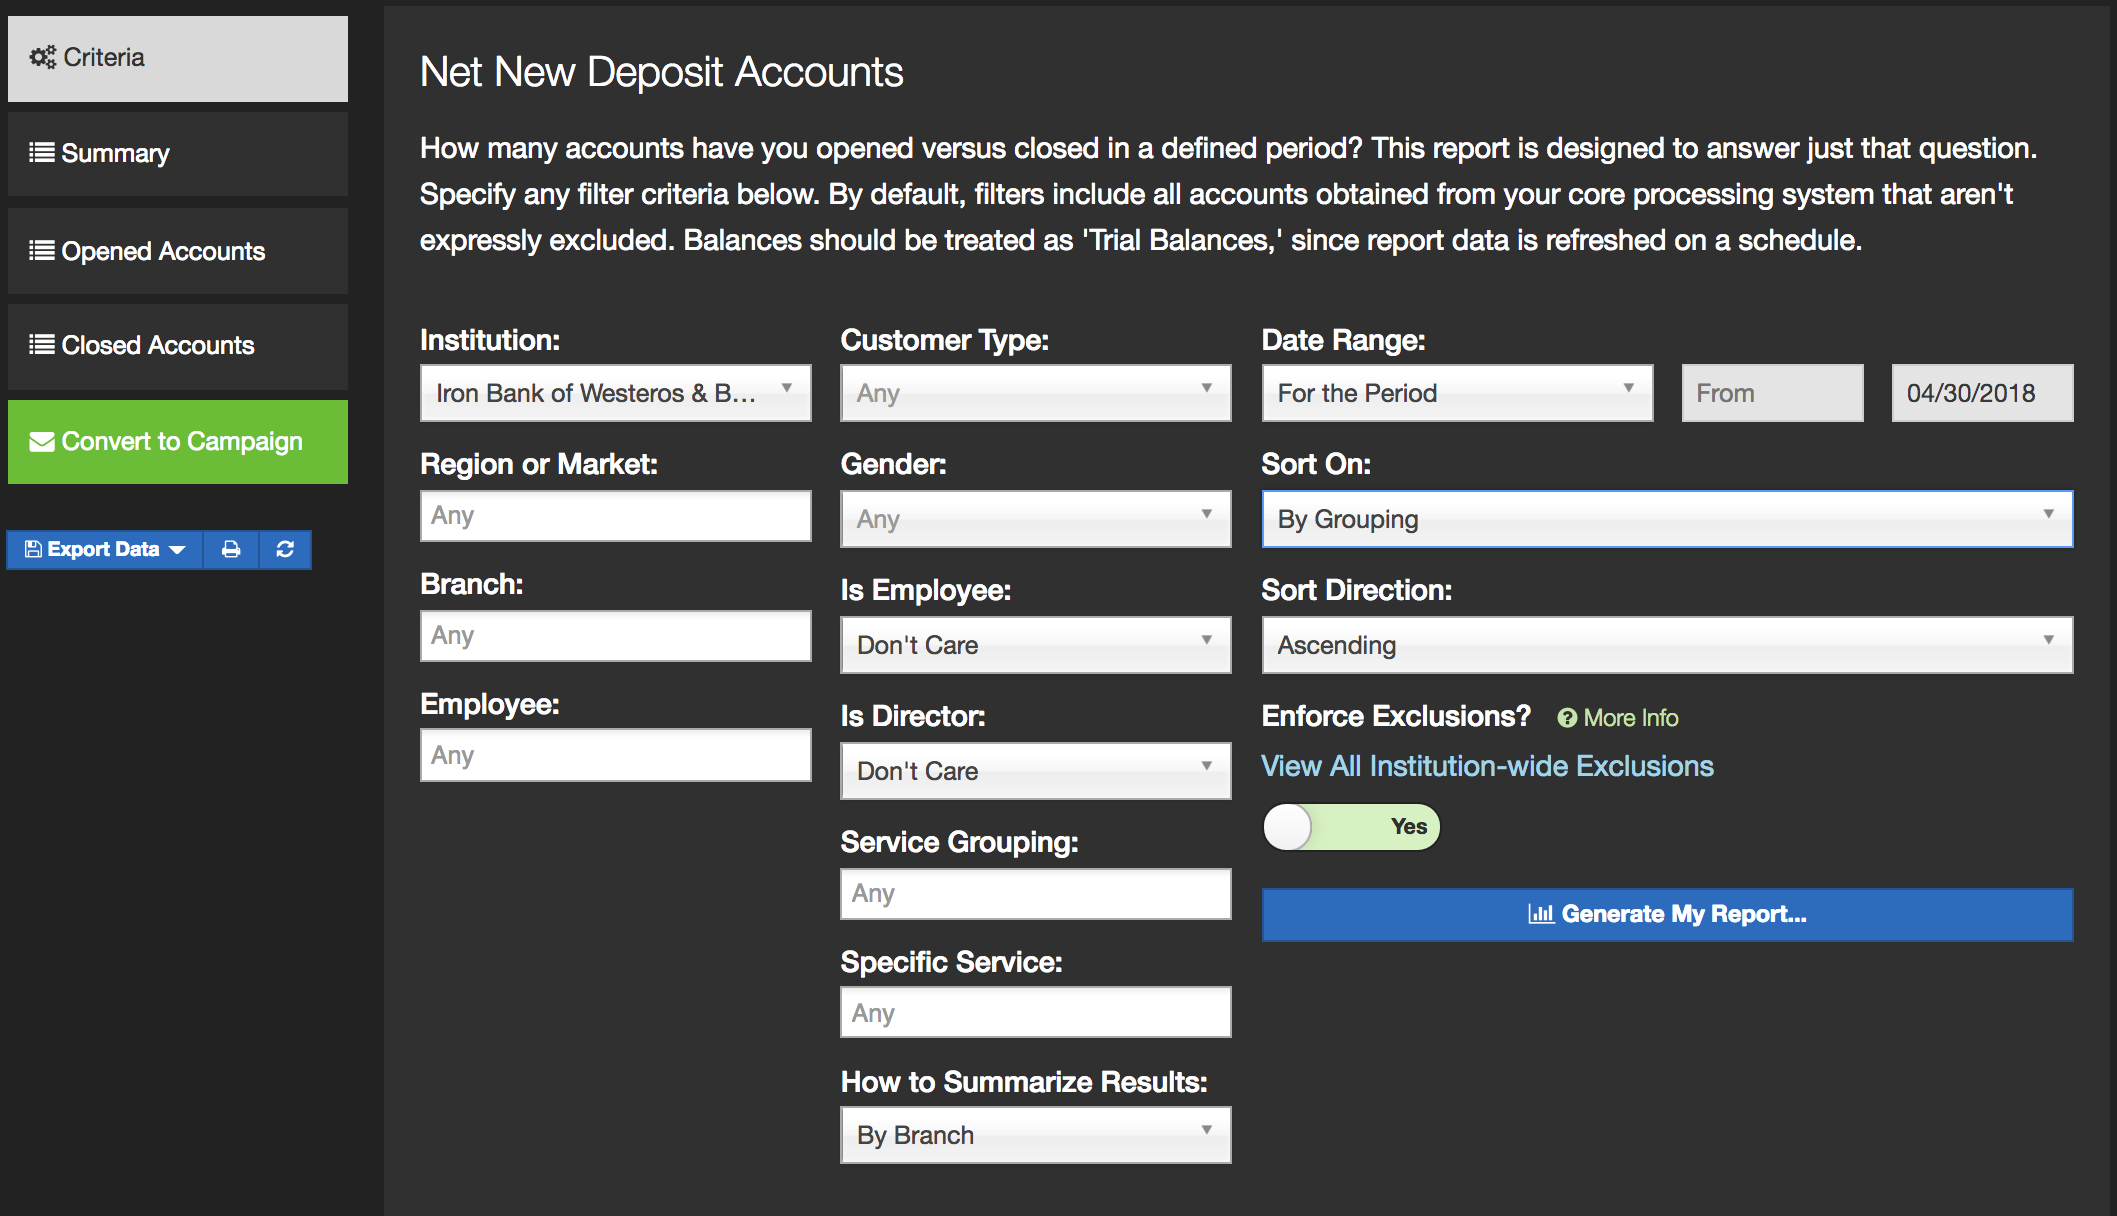
The fields for this report are very similar to many of the other reports within Core iQ. The left-hand column will allow you to drill down on the institution level, going from Bank to Region to Branch and finally to Employee. The middle column of the report will allow you to make decisions about the types of customers you want to include in this report. Should they be only Nonbusiness? Should employees or directors be included? Do you want to look at only the net new accounts for a specific product or group of products?
The last column of filters allows you to choose the date range that you want to view, as well as basic sorting options for the report output. By default, each of the Net New Accounts reports will be run for the previous calendar month. You can make changes to the left or right-hand value of the date field to modify the range of time for Core iQ to look for Opened or Closed accounts.
One unique field in this middle column is the How to Summarize Results dropdown. This option allows you to select the way that you would like Core iQ to report back results to you for this report. You can choose to summarize your results by the specific product, Service Group, Branch, Banker, or higher level Region/Bank.
Choosing to summarize your report by the specific service or Service Group will give you an output of the changes on a product-level at your financial institution. Core iQ will only pull the types of products that you have specified within the report and within the larger group set by the report (Loan v Core Deposit v Timed Deposit). This is a great way to assess the overall product penetration for a specific group of services at your financial institution.
Choosing to summarize your report by Branch or Banker is also extremely useful. This will roll up the changes in products to a higher level, thus allowing you to see changes in the number of products assigned to each branch or banker. You will still be provided with a list of the specific accounts that were opened and closed within the Opened Accounts and Closed Accounts tabs. However, the Summary tab will list individual branches or bankers, and the counts will be rolled up to this higher level.
How can I use these reports to find opportunities for growth?
If you are pulling the Net New Core Deposit or Net New Loan reports report solely on a branch level, then the best use for the results data is to assess your product adoption for each branch. Identifying the highest and lowest performing branches for each of these product types can allow you to identify areas of growth. With your lowest performing branch, it is recommended that you revise the Criteria area to look solely at this branch and then summarize by Service Group. This should help you identify the Service Groups that are either seeing the lowest adoption or the highest turnover. Using these metrics, you should be able to identify the problem areas for the branch and devise a strategy for solving them.
If you are looking at the Net New Loan report, and you are consistently assigning Loan Officers as Assigned Bankers to accounts on your core, you can use this report to identify employee assignments for loan accounts. Summarizing based on the Branch first, and then the Banker can help you find the highest performing employee at your best performing branch, or the lowest performing employee at your lowest performing branch. These two pieces of information can help you find better ways to increase your loan products throughout your organization.